Care and Treatment
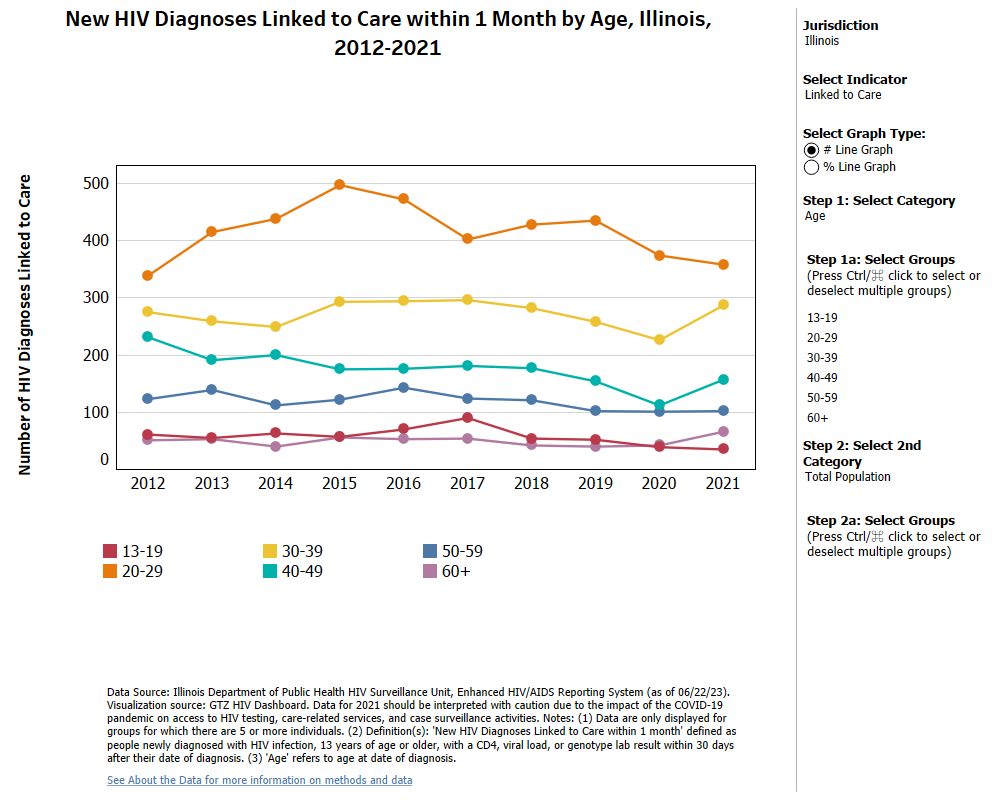
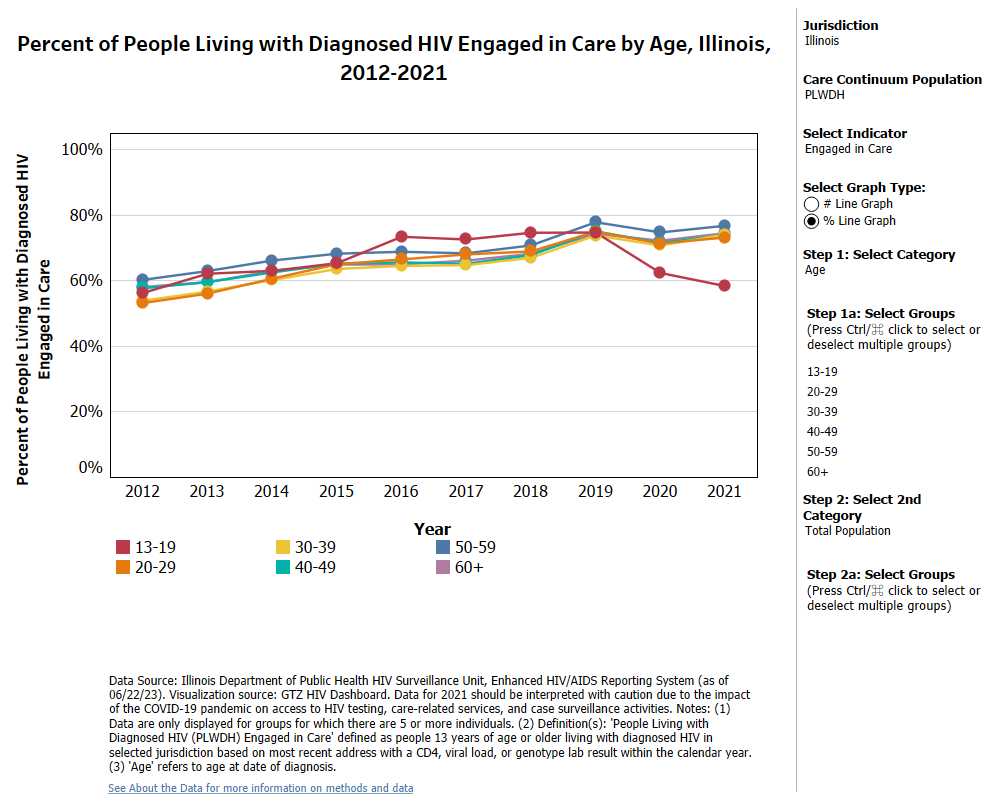
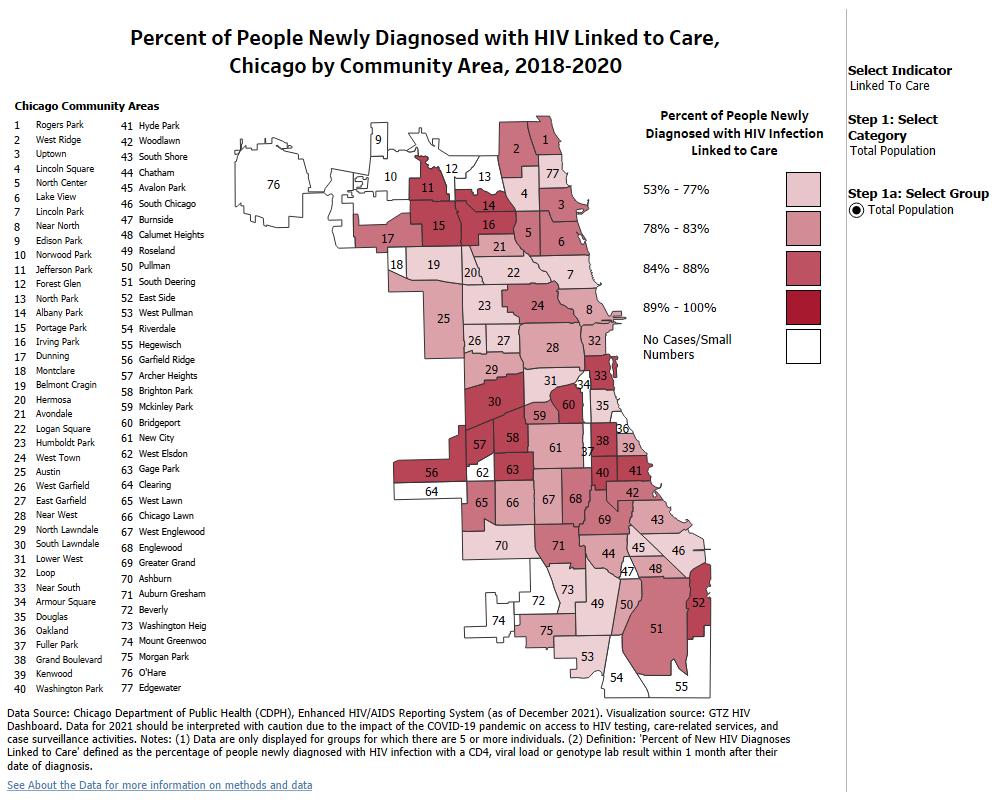
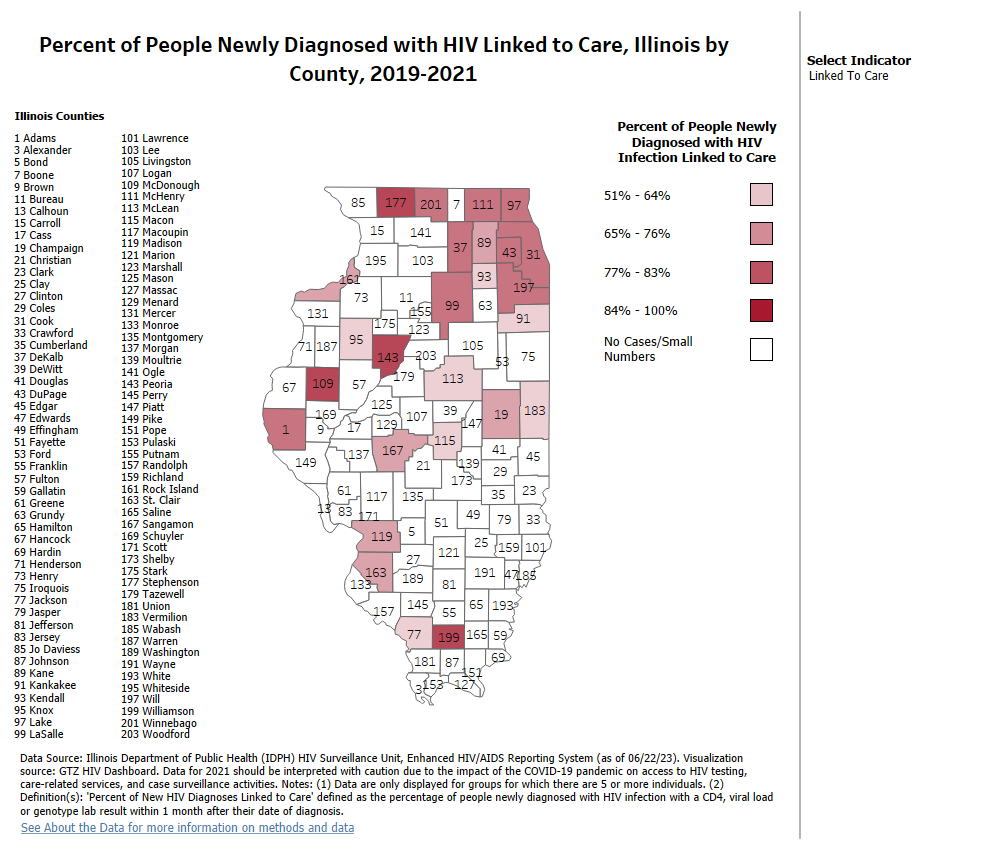
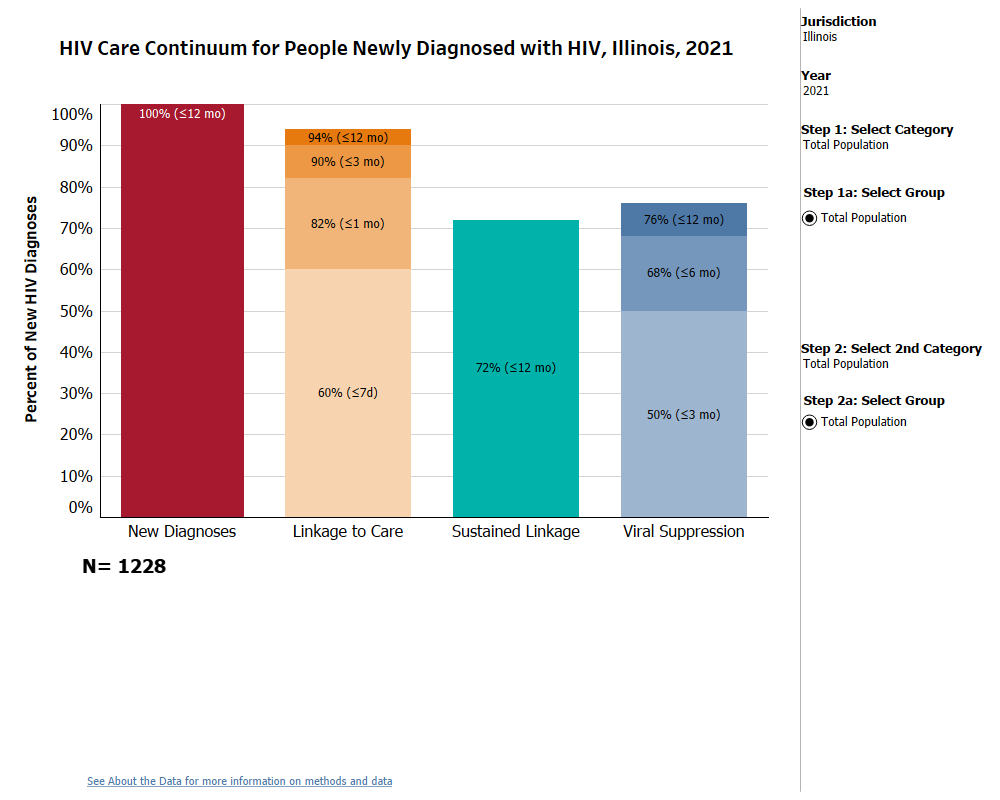
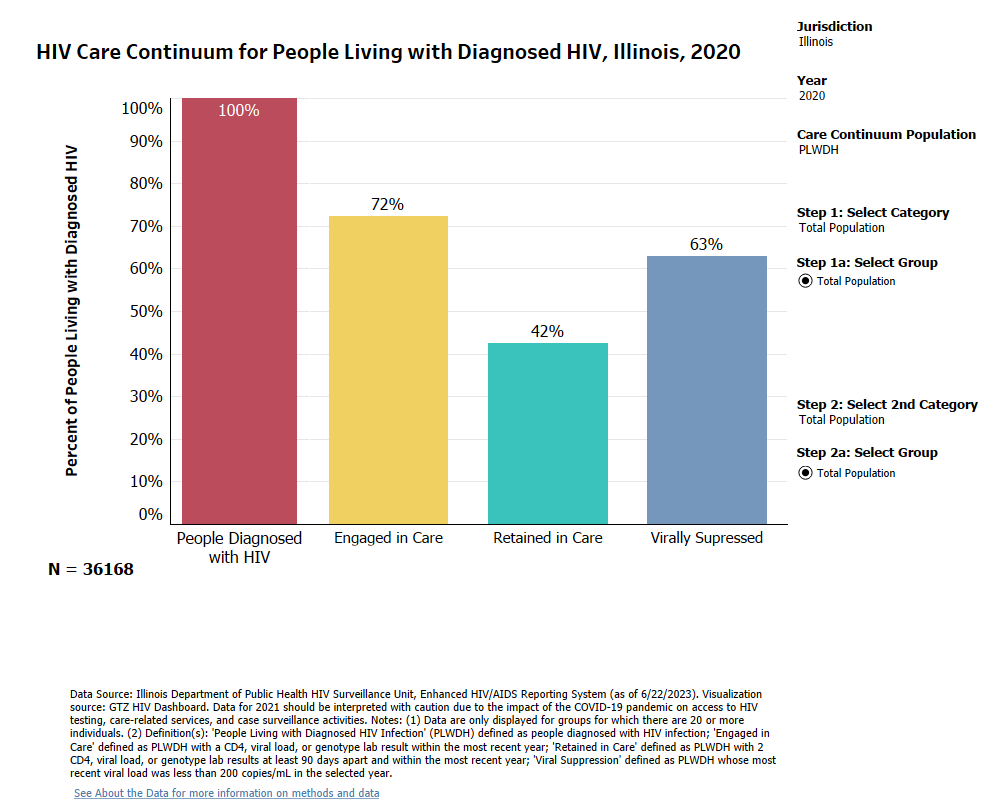
The graphs on this page are associated with GTZ-IL Strategies 12, 14, 15, 31-34. You can customize the following graphs by selecting “Interact” below or by selecting the graph directly from this list:
Mobile Device Warning
For optimal viewing, please use a desktop device.

Trends in HIV Continuum Indicators Among Newly Diagnosed
Interact
Trends in HIV Continuum Indicators Among People with HIV
Interact
Continuum Indicators Map (Chi)
Interact
Continuum Indicators Map (IL)
Interact
Days from Diagnoses to First Care Event
Interact
HIV Care Continuum Among Newly Diagnosed
Interact